News
Updates to the ezEML Metadata Editor
May 1, 2024
Jon Ide
Description
Many of you are already familiar with the ezEML Metadata Editor developed at the EDI Repository, but for those that need an introduction, it has become a very easy but powerful way to publish your research datasets. If you’re using this as part of your workflow to publish datasets or would like to try it in the future, there are a couple of new features that you might be interested in:
Bulk Edit Data Table Column Properties via a Spreadsheet
The Edit Column Properties page for a data table now includes buttons Download Column Properties Spreadsheet and Upload Column Properties Spreadsheet. The download button creates a spreadsheet (.xlsx file) pre-populated with the current values of the column properties and downloads it to your computer. You can then edit the spreadsheet in Excel or other spreadsheet application, changing the values of the properties as needed. Use the upload button to upload the edited spreadsheet and update the column properties all at once. For wide tables, especially, this makes your life easier. Watch a short video demonstration here: 
Navigation via Colored Badges
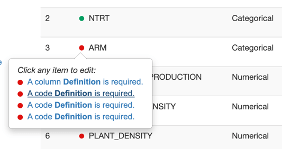
Colored “badges” now indicate all errors and warnings associated with the various sections and elements of an ezEML data package. Badges next to a section or item are red, yellow, or green to indicate the presence of errors, warnings, or neither. They let you see at a glance, for example, which columns in a data table still have metadata issues. The badges are clickable, displaying lists of errors and warnings, and the errors and warnings are themselves clickable, taking you directly to the item that needs to be added or edited, scrolling it into view and highlighting it.
Watch a short video demonstration here:
Explore Data Tables feature
Explore Data Tables lets you open your data tables in EDI’s Data Explorer (DeX) app. With DeX, you can get an overview of your data and perform various sanity checks on the data: profile it, subset it, view plots, etc.
Please give these a try and let us know what you think. We’d love to hear your feedback (support@edirepository.org), and we’re hoping this makes your publication experience at EDI easier.